Limburg
(Limburg · ليمبورخ · Limburg)Province of the Netherlands
Capital: Maastricht
Cities & Towns
729 places totalLimburg covers 2 210 km². The provincial capital is Maastricht.The province has a population of 1 158 089, with a density of 524 people per km².
699 more places in Limburg not shown.
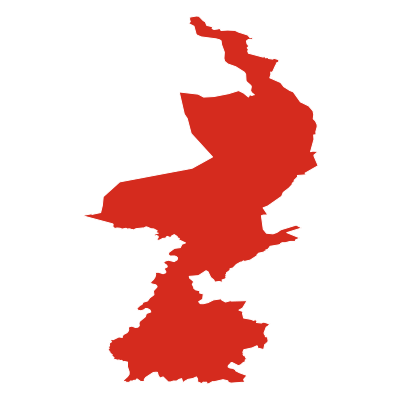
Province Maps
SVG and PNG downloads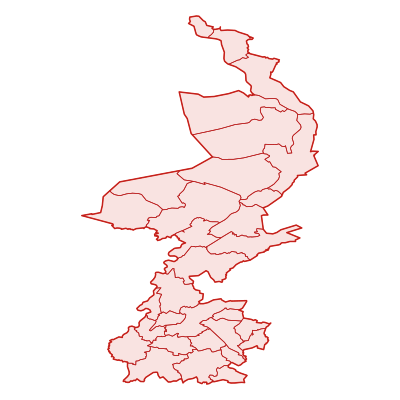
Postcodes
161 postcodesLimburg has 161 postcode areas covering 5 256 km² with 3 424 buildings. Limburg uses the prefixes 6 / 5 - postcodes in Limburg start with 6xxx, 5xxx (these zones). The postcode with the most buildings is 5928RG (Venlo) (174 buildings).
| # | Code / Name | Population | Area | Buildings | |
|---|---|---|---|---|---|
| 1 | 5928RG | 86 165 | 120.77 km² | 174 | View → |
| 2 | 6219NB | 65 975 | 32.31 km² | 30 | View → |
| 3 | 6414GZ | 42 177 | 27.58 km² | 14 | View → |
| 4 | 6041TR | 36 365 | 61.21 km² | 80 | View → |
| 5 | 6598BM | 11 201 | 50.43 km² | 17 | View → |
| 6 | 6225KD | 9 835 | 4.82 km² | 15 | View → |
| 7 | 5987AP | 6 879 | 126.6 km² | 51 | View → |
| 8 | 5944EX | 5 181 | 5.29 km² | 100 | View → |
| 9 | 6039HC | 5 174 | 93.33 km² | 13 | View → |
| 10 | 6225XX | 4 911 | 2.4 km² | 16 | View → |
Limburg has 1380 postal facilities 123 Post Offices, 1142 Post Boxes, 115 Parcel Lockers.
Transport
60 lines across 133 routesClick a route on the map to see details. Zoom in to explore individual stops.
Limburg has a public transport network of 1669.6 km with 60 transit lines and 133 routes. It is served by 6 operators.
Full transport overviewPopulation & Building Density
By municipality| # | Municipality | Population | Pop/km² | Buildings | Bld/km² | Area km² |
|---|---|---|---|---|---|---|
| 1 | Kerkrade | 47 889 | 2161 /km² | 33 532 | 1513 /km² | 22.1532 km² |
| 2 | Maastricht | 122 755 | 2042 /km² | 60 479 | 1006 /km² | 60.1129 km² |
| 3 | Heerlen | 87 223 | 1916 /km² | 58 728 | 1290 /km² | 45.523 km² |
| 4 | Brunssum | 28 358 | 1635 /km² | 21 278 | 1227 /km² | 17.337 km² |
| 5 | Landgraaf | 38 098 | 1544 /km² | 28 378 | 1150 /km² | 24.6637 km² |
| 6 | Sittard-Geleen | 93 118 | 1155 /km² | 68 576 | 851 /km² | 80.5824 km² |
| 7 | Stein | 25 050 | 1098 /km² | 16 246 | 712 /km² | 22.7977 km² |
| 8 | Venlo | 124 682 | 966 /km² | 74 190 | 575 /km² | 128.9975 km² |
| 9 | Roermond | 59 293 | 834 /km² | 37 234 | 524 /km² | 71.0526 km² |
| 10 | Meerssen | 21 945 | 793 /km² | 12 736 | 460 /km² | 27.6568 km² |
| 11 | Beek | 16 073 | 762 /km² | 10 196 | 483 /km² | 21.0763 km² |
| 12 | Simpelveld | 11 406 | 711 /km² | 8 376 | 522 /km² | 16.0217 km² |
| 13 | Beekdaelen | 38 325 | 488 /km² | 30 181 | 384 /km² | 78.4804 km² |
| 14 | Valkenburg aan de Geul | 17 515 | 474 /km² | 11 159 | 302 /km² | 36.9191 km² |
| 15 | Weert | 49 599 | 470 /km² | 34 609 | 327 /km² | 105.5407 km² |
| 16 | Beesel | 13 442 | 461 /km² | 12 140 | 416 /km² | 29.1551 km² |
| 17 | Mook en Middelaar | 7 795 | 414 /km² | 6 771 | 359 /km² | 18.8136 km² |
| 18 | Maasgouw | 23 894 | 411 /km² | 21 296 | 366 /km² | 58.1235 km² |
| 19 | Vaals | 9 690 | 405 /km² | 7 133 | 298 /km² | 23.8935 km² |
| 20 | Voerendaal | 12 555 | 398 /km² | 10 409 | 330 /km² | 31.5174 km² |
| 21 | Gennep | 17 054 | 338 /km² | 16 963 | 336 /km² | 50.4294 km² |
| 22 | Eijsden-Margraten | 25 675 | 326 /km² | 20 227 | 256 /km² | 78.7598 km² |
| 23 | Echt-Susteren | 32 495 | 310 /km² | 29 355 | 280 /km² | 104.6182 km² |
| 24 | Peel en Maas | 43 360 | 268 /km² | 34 913 | 216 /km² | 161.3616 km² |
| 25 | Venray | 43 595 | 264 /km² | 34 923 | 211 /km² | 165.0179 km² |
| 26 | Roerdalen | 20 710 | 233 /km² | 19 691 | 221 /km² | 88.7855 km² |
| 27 | Leudal | 35 890 | 217 /km² | 30 133 | 182 /km² | 164.9103 km² |
| 28 | Horst aan de Maas | 40 091 | 208 /km² | 42 776 | 222 /km² | 191.9496 km² |
| 29 | Gulpen-Wittem | 15 070 | 205 /km² | 12 548 | 171 /km² | 73.3565 km² |
| 30 | Bergen | 18 408 | 169 /km² | 13 231 | 121 /km² | 108.5055 km² |
| 31 | Nederweert | 17 036 | 167 /km² | 15 428 | 151 /km² | 101.7878 km² |
Symbols
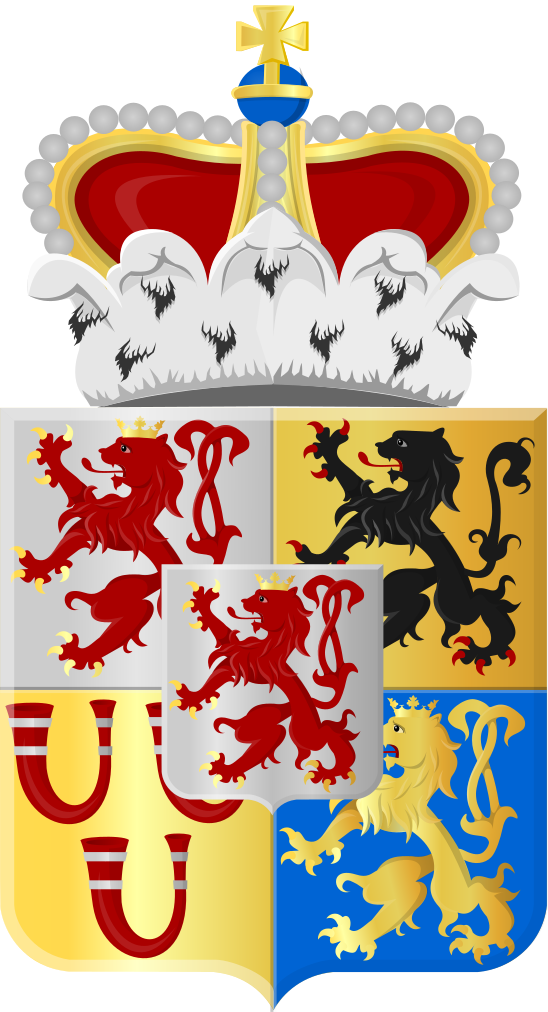
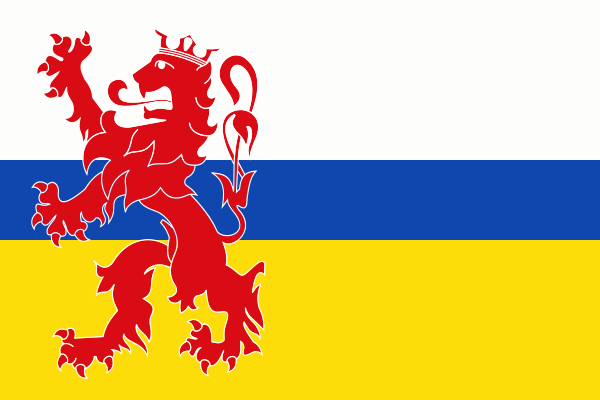
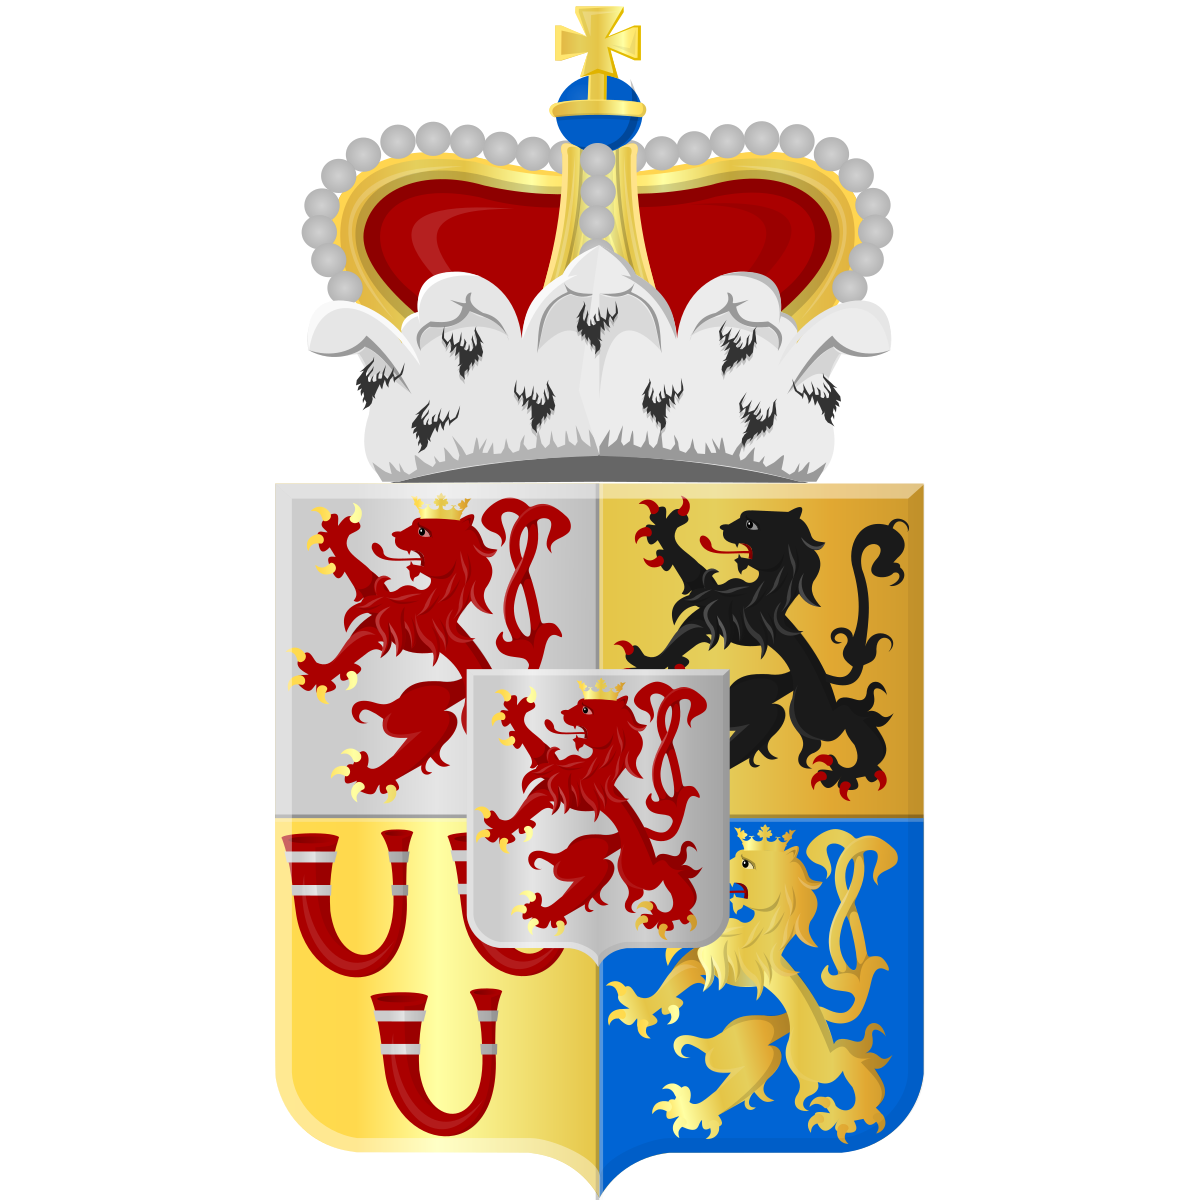
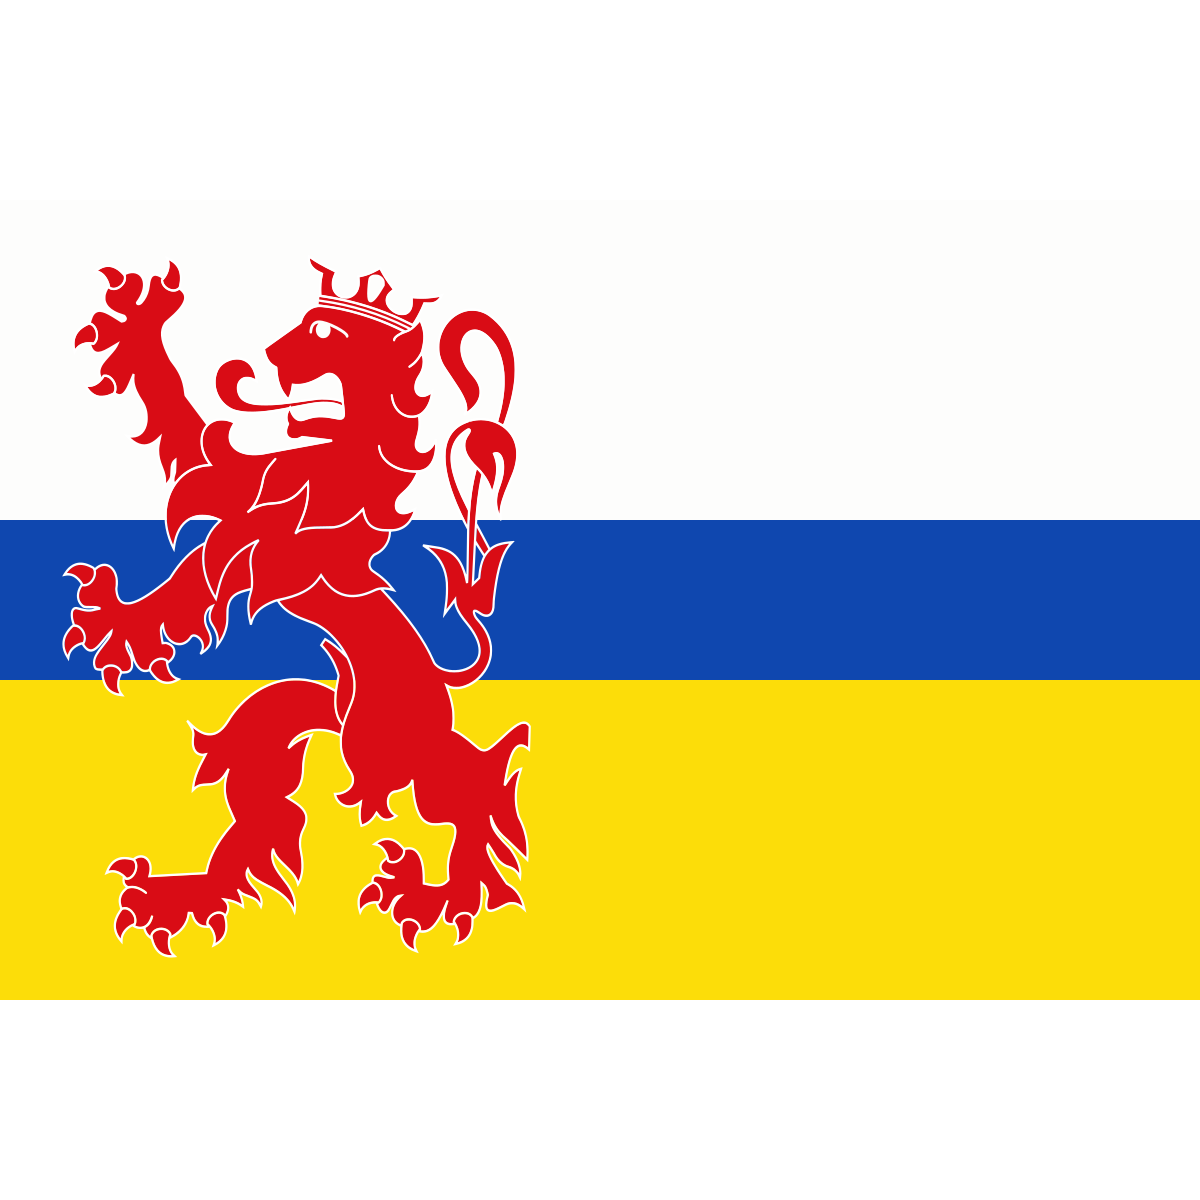
Official symbolsThe official symbols of Limburg include the coat of arms and flag, both of which appear on government documents and are recognised across the Netherlands.
Province Rankings
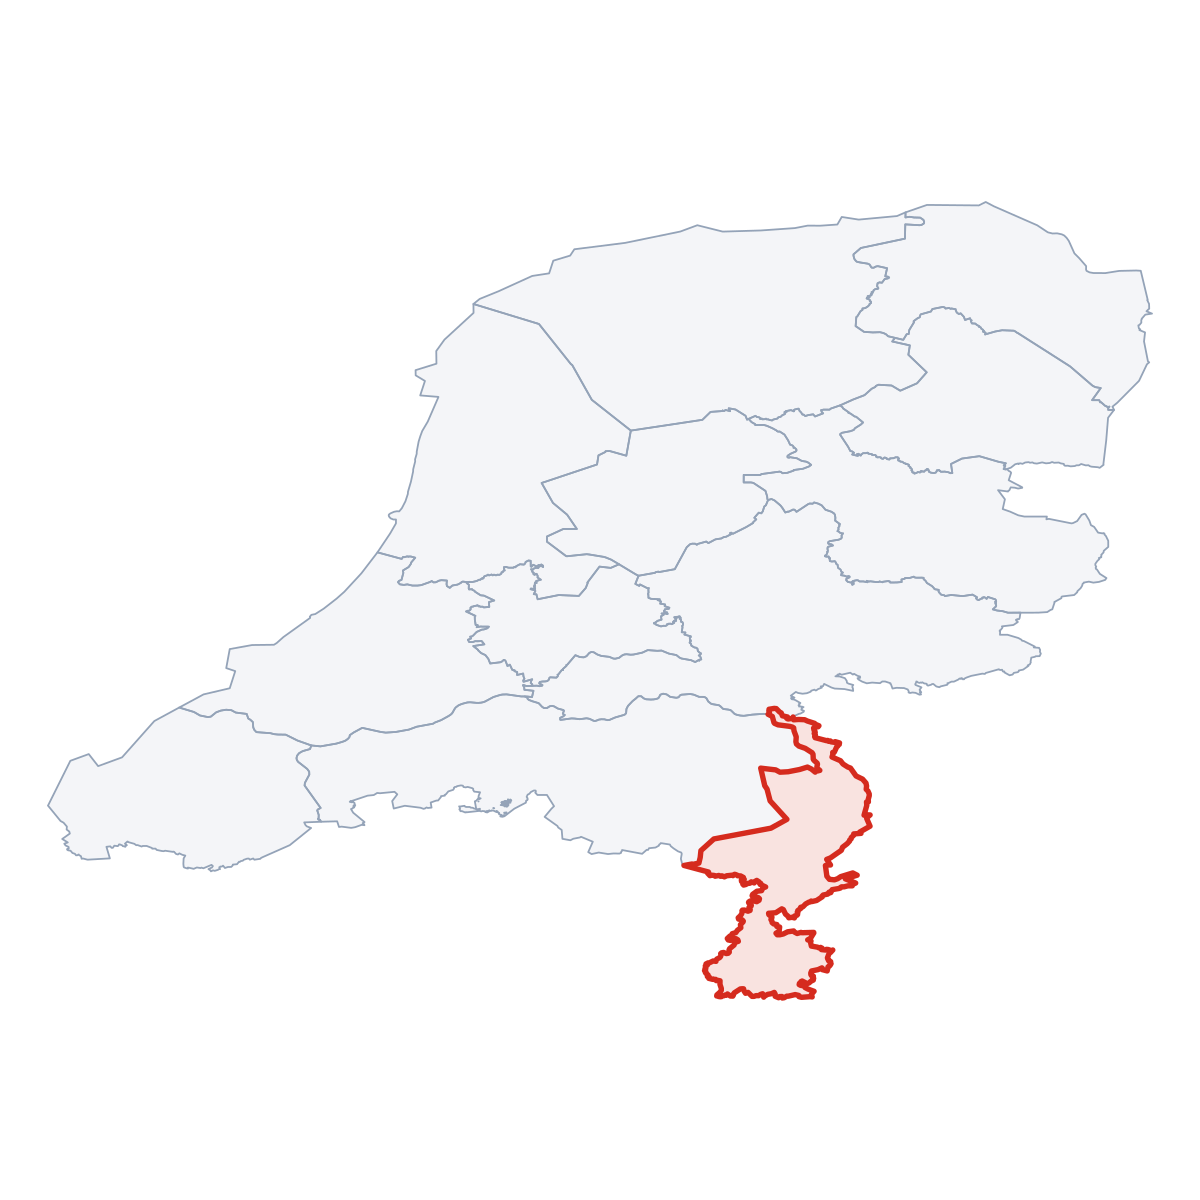
Compared to all 12 provincesLimburg ranks 7th by population (of 12), 11th by area (of 12), 4th by population density (of 12) among the 12 provinces of the Netherlands.
Neighbouring Provinces
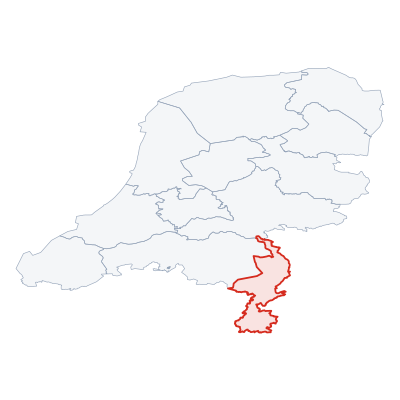
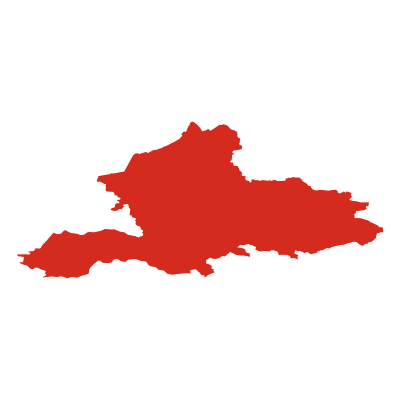
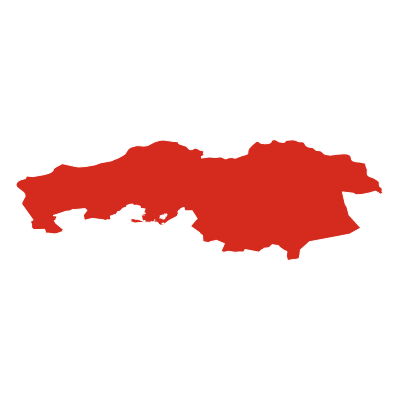
2 bordering provincesLimburg borders 2 provinces: Gelderland (canton.direction_n), Noord-Brabant (canton.direction_nw).
Nature Areas
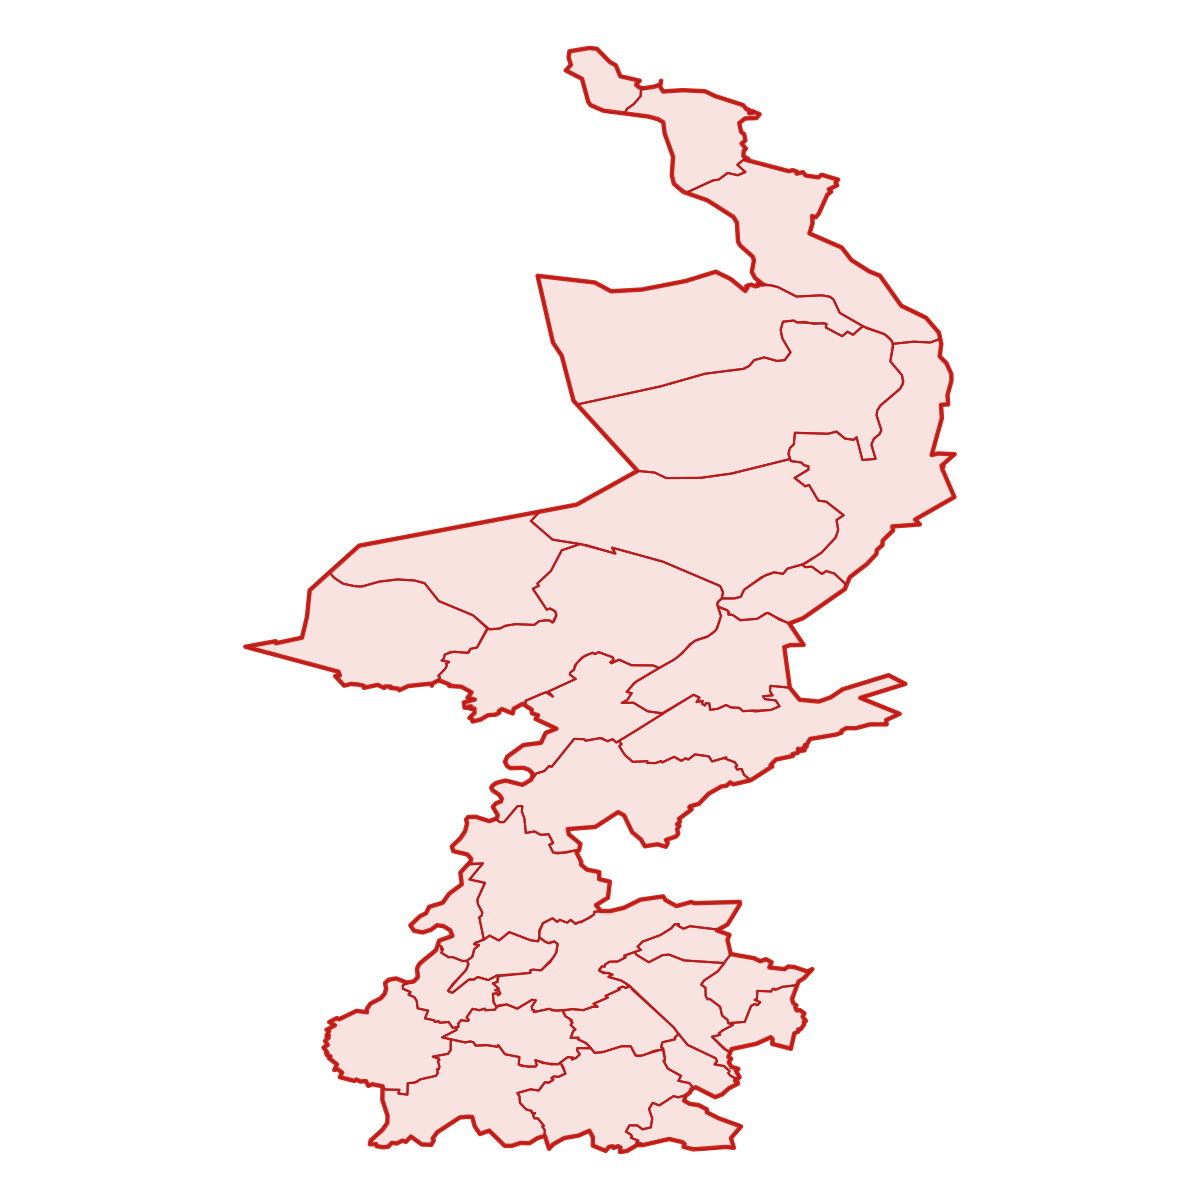
3 parks and nature reservesLimburg contains 3 protected nature areas: De Maasduinen, De Meinweg, De Groote Peel.


Frequently Asked Questions about Limburg
Quick answers about this provinceWhat is the capital of Limburg?
The provincial capital of Limburg is Maastricht with a population of 120 105.
How many people live in Limburg?
Limburg has a population of 1 158 089, spread across 2 210 km².
How large is Limburg?
Limburg covers an area of 2 210 km² (approximately 853 square miles).
Is Limburg a province or a city?
Limburg is one of the 12 provinces of the Netherlands, covering a defined administrative region. Its provincial capital is Maastricht.
What postcodes are in Limburg?
Limburg has 161 postcode areas. Postcodes in Limburg use the prefix 6, 5.